Time: 2022-08-17 Preview:

"On April 29, the "2021 China Quantitative Investment White Paper" jointly organized by Huatai Securities, Kuanbang Technology, Amazon Cloud Technology, Chaoyang Sustainability, Finelite and other market authorities was officially released, and a press conference was held in Shenzhen. Lin Xiaoming, chief financial engineer of Huatai Securities Research Institute, attended the meeting and gave a keynote speech. We recorded the text for readers.”
01 Preface
I have been engaged in quantitative research since 2008, and I have witnessed the pattern of quantitative investment from a marginal category to the explosion of quantitative private equity in recent years, with an increasing market share and increasing importance. Along the way, every practitioner will have their own feelings and experiences, but no one has done a detailed review of the process of quantitative development; for the current situation of the quantitative market, there is no institution or book that specifically and systematically portrays China's quantitative investment. ecology.
The "2021 China Quantitative Investment White Paper" has been prepared for several months. The content is very detailed and comprehensive. It fills the gap very well. It is an ideal reading for practitioners to understand the whole picture of the quantitative industry. So I'm especially happy to be able to witness the release of this book today.
I am honored to be invited to the conference today. I would like to share the research layout of our team in the field of quantification, which is mainly divided into three parts: the overall framework of the team's quantitative research, the framework of asset allocation of major categories, and the series of artificial intelligence research .

02 Basic research framework: long, medium and short three models
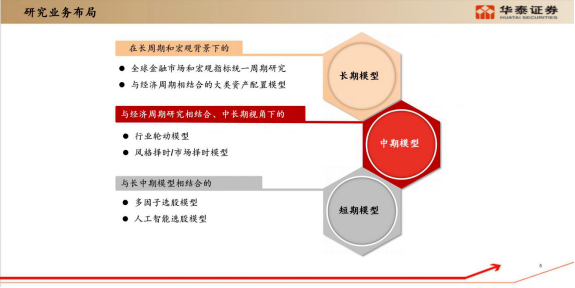
In the 6 years of Huatai, our team has built three models of long-term, medium-term and short-term. The research core of the long-term model is the financial market and the macro cycle, which is mainly based on theoretical research. While studying the cycle theory, it is combined with the model to carry out a practical attempt to allocate large-scale assets.
Mid-term studies include industry rotation and style, timing studies. Our team has been working in the field of industry configuration and style configuration for a long time. From the earliest overseas paper verification to the construction of characteristic models, we have accumulated dozens of in-depth reports.
Short-term research is mainly divided into multi-factor models and artificial intelligence stock selection models. Since the launch of the first artificial intelligence stock selection report on June 1, 2017, we have been researching artificial intelligence for a full 5 years, covering a series of topics such as model testing, factor mining, overfitting testing, generative adversarial networks, etc. More than 50 in-depth reports have been published.
The essence of asset management business is that data flow drives capital flow. Our overall understanding of quantitative investment includes three points:
First point: The core function of financial markets is to price what happens in the real world.
The second point: all financial market prices are essentially to reflect the basic state of the object . Fundamental status not only refers to the value investment brought by the fundamentals and operating conditions of the company, but also the supply and demand of stocks in one or 10 seconds in the short term, and the trend of the global macro economy.
Third, the essence of asset management business is that data flow drives capital flow. Our asset management business, whether through quantitative or qualitative methods, is essentially a business where data flow drives capital flow. The core competition of the asset management industry is the labor productivity of the industry. The real world we live in is extremely complex, and any model is too simple compared to the entire world; and the world is constantly changing, so no enterprise, model or system can It is valid for a long time and must be kept updated synchronously. The same is true in the financial industry. Whether it is macro, fundamental stock selection or high-frequency trading, we use data to describe changes in the environment, which is essentially a business where data flow drives capital flow.
03 High frequency and low frequency circuits are more cost-effective
Starting from the frequency of transactions, we divide all transactions into high frequency, medium frequency and low frequency. Medium frequency is based on medium frequency data to drive transactions, including traditional company fundamental research, stock price K-line chart, etc. The vast majority of institutional investors and individual investors are concentrated in this field, so IF is also the most crowded market in China. In the long run, we believe that high frequency and low frequency are the two areas with higher cost performance.
The high-frequency field is a high-threshold track . Back then, the "Ningbo Suicide Squad" model was based on the short-term mining law of stock volume and price for short-term trading. At that time, there were not many people who could do this part of the business, so the price-performance ratio was relatively high. In recent years, the rapid rise of quantitative frequency is also because of this part. The competitive intensity is relatively low. If institutions want to intervene in this field, they need professional talents in computer, statistics, financial engineering and various infrastructures, and the hard threshold is very high; at the same time, restrictions on transactions have led to the development of large institutions such as public offerings and insurance in high frequency. limit. Therefore, the high-frequency field is a low-crowded and promising track.
The low frequency field is a difficult track. At present, investors who do asset allocation and macro allocation still have a high frequency of switching views. Whether it's a central bank meeting, or a situation in the world, it will affect trading, position swaps, or changes in views; even for macro hedging, there will be new views trading every two weeks. In the ultra-low frequency field, there are very few investors who hold their assets for half a year or a year, and their core logic is also different from the above-mentioned driving factors; ultra-low frequency investment requires accurate long-term judgment, and it is very difficult to find logic. , but it also has more room for development.
04 Use cycles to answer three questions for forecasting financial economic systems
Higher frequency means larger volumes of data, more obvious data- and statistics-driven patterns, and quicker validation of results. In the ultra-low frequency field, the sample size is very small, and the degree of dependence on models and statistics decreases; and the difference in judgment will have a continuous impact in the future, so the reliability of logic is very important. Therefore, the model in the ultra-low frequency field may be very simple, but a lot of analysis and verification need to be done behind the model to ensure the reliability of the core logic.
From 60/40, mean variance, risk parity to Merrill Lynch, there are many models of asset allocation, but in summary, they can be divided into two categories, namely passive models and active models. We believe that with the exception of Merrill Lynch's investment clock, other asset allocation models are basically passive models. These models consider the market to be unpredictable, calculate returns, volatility, and covariance matrices based on historical data, and build combinations under assumptions; these models are essentially passive models that solve the optimization problem of risk and return. The Merrill Lynch clock is an active model. No matter whether it is running or not, the effect is good or not, its biggest contribution to asset allocation is to clarify one thing: changes in the macroeconomic environment and the relative strength of asset prices exist with the mapping relationship. If there is such a stable mapping relationship, active asset allocation can beat the market.
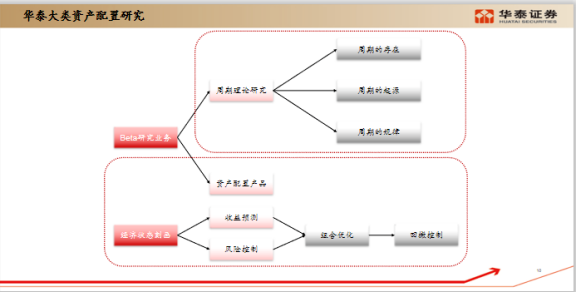
Our team's research on asset allocation models is divided into two parts. One is the research on cycle theory, including the existence, origin and law of cycles. Its core is to explore three questions: whether the financial and economic system can be predicted, why can it be predicted, and how should it be predicted? to predict . We launched the "Order of Industrial Society" in May last year to answer these questions with an in-depth report of more than 170 pages; at the same time, we are also studying the characterization of the economic state, including the forecasting of returns, the control of risks, and the optimization of portfolios and pullback control.
If all asset prices are regarded as macro variables, after the year-on-year calculation, it will be found that global asset prices and macro variables have obvious periodicity; then using standard Fourier transform or periodic wavelet transform, it can be demonstrated from the spectrum The existence of the cycle; finally, based on the MUSIC algorithm part, for 148 macro variables and asset prices, from as short as 20, 30 years to as long as 100 years of data, the cycle is verified. This answers the first question, whether the financial and economic system is predictable.
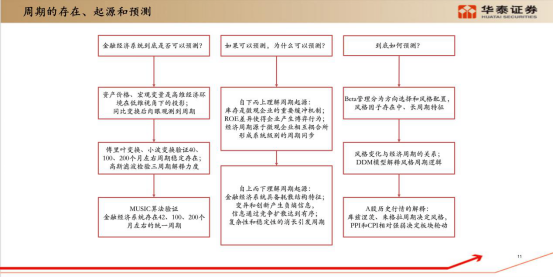
The second question is, if it can be predicted, why can it be predicted ? We make logical derivations from both top-down and bottom-up perspectives. After the human society has entered the industrial society, the division of labor will inevitably lead to cyclical fluctuations, which is the same as the Jugella cycle conclusion: economic recession is also a cyclical fluctuation of the economy, which itself is a part of the steady state of the economic system, and the economy does not experience recession. On the contrary, it is not normal. Uncertainty factors trigger various mechanisms, which will eventually form cycles.
The third question is, how do we predict cycles? After we remove the trend items of the style factors such as value and momentum factor in the quantification, we will find that the market style of A-shares is very consistent with the trend of the US dollar index: when the US dollar is rising, A-shares show a growth style, and when the US dollar is falling, A-shares show a growth style. value style. The logic is also very clear: when the global economic cycle begins to rise, capital will flow from the United States to emerging markets, the dollar will depreciate and inflation will rise, that is, the numerator and denominator of the DDM model will rise at the same time. At this time, it is the numerator that drives the financial market, so it creates value investing. Quotes. Conversely, when the global economic momentum weakens, capital will flow back to the U.S. market. At this time, the dollar appreciates, the numerator and denominator of the DDM model go down at the same time, the driving force changes from the numerator to the denominator, and the interest rate goes down to support the high valuation market. It becomes a growth stock market.
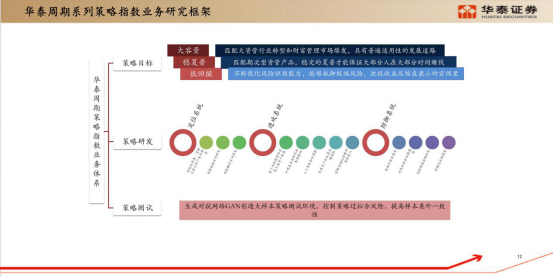
Based on these theoretical studies, we spent three and a half years to build a set of dozens of strategy indices, aiming at large capacity, stable sharpness, and low drawdown. Now it has been iterated to the third generation. The index is published on the Singapore Exchange, Wind and Bloomberg update the net value of the strategy index daily, and our derivatives department develops OTC derivatives based on the strategy index. This is a set of ultra-low-frequency indices. It allocates stocks, bonds and commodities around the world. The positions are changed every 20 months, and no adjustments are made to any environmental changes in the middle. We always think that the model has to have belief, and the core of the model is to have a high long-term win rate.
05 Use cycles to answer three questions for forecasting financial economic systems
On June 1, 2017, after half a year of preparation, we released the first in-depth report on artificial intelligence; in the next five years, we have launched more than 50 in-depth studies, and slowly formed a systematic research framework, which currently includes Model testing, factor mining, combating overfitting, generative adversarial networks, and others in a total of 5 series.
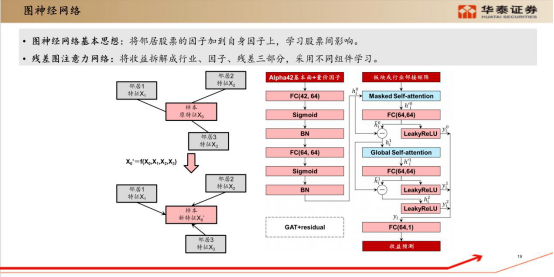
Model testing is our first series. At the beginning, we transformed based on the traditional multi-factor model, adopted classic stock selection factors such as fundamental factors and trading factors, tried to integrate these factors with various machine learning algorithms, and found that the decision tree ensemble model was relatively more suitable for selection. stock scene. What we are doing recently is a graph neural network. The basic idea of a graph neural network is to add the factors of neighboring stocks to its own factors to learn the influence between stocks; we also draw on academic research to design a residual graph attention network to split the income. It is divided into three parts: industry, factor and residual, and different components are used for learning, which is further improved compared to the original model.
In terms of factor mining, we do three parts: genetic programming, AlphaNet and text mining. The high-frequency field is driven by pure volume and price. When the hardware is not enough and you want to mine these factors that the human brain cannot understand, you can use the process of natural evolution to mine factors by genetic programming. AlphaNet is end-to-end, allowing the machine to directly generate all possible factor expressions for us from start to finish. In the text mining part, there are a large number of research reports and news every day. We can also use some semantic analysis methods to mine effective information.
There are many controversies in the fight against overfitting, and different companies have different approaches and different views on the interpretability of factors. There is a saying that is particularly good: " Technical analysis does not ask why, but it is not technical analysis. " I have always believed that if these factors can be understood, machine learning models cannot be used; machine learning models can be used, it is Because the human brain is incomprehensible. If you want to use these algorithms to mine factors, the best way is not to ask why, but to use a set of comparative sciences to perform overfitting tests and optimize from the process.
Next we launched a series of real and fake k-line recognition and generative adversarial networks. The idea of this part of the study originated from a question about the validity of technical analysis. We take out the real K-line, shuffle its order and regenerate it, and ordinary people can't tell which is real and which is fake with the naked eye. So we use the neural network to learn to distinguish these true and false sequences. If we can effectively distinguish true and false sequences, it means that the real k-line does have a rule; maybe we can’t see it with the naked eye, but the machine can learn it.
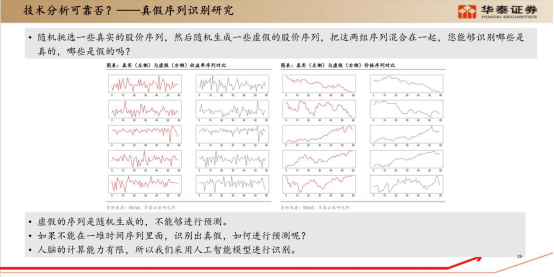
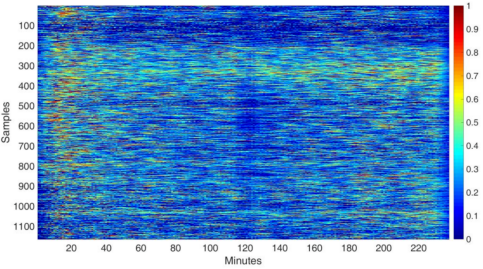
The research results show that the machine cannot distinguish the daily K-line, which shows that the daily K-line is more competitive, close to the assumption of the efficient market theory, and it is difficult to predict from the historical price. But the higher the frequency, the better the resolution. The vertical axis of the figure below represents the graph of each minute. The lighter the color, the more difficult it is to distinguish it. The red timing can be clearly distinguished, indicating that there is transaction information when the market opens in the morning and closes in the afternoon. In 2015, when the market volume was particularly high, the model was basically able to differentiate throughout the day.
In fact, the financial market is a reflection of real life. When new economic factors appear in real life, it will definitely be injected into the market through transactions. When a large amount of information is injected into the trading market, a certain local structure may be formed in the data; even if it is invisible to the naked eye, it must be regular, and the data analysis of volume and price is looking for this some rules.
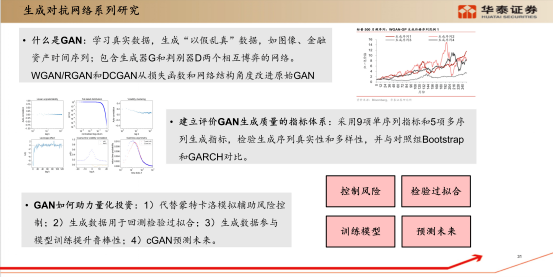
The last is Generative Adversarial Networks. There are many critics in the financial field, and in-sample overfitting is one of the major pain points: the in- sample effect is good, but the actual effect is not satisfactory . All models are based on historical samples to analyze and find regularities. When the sample size is not sufficient, it is difficult to judge which are long-term regularities and which are overfitting. Therefore, we believe that the financial field needs more high-quality fake data to assist model validation. It's a series we've been focusing on for the past two years, and it's yielding some interesting results.
Finally, to make a conclusion, our research framework covers three fields of high frequency, medium frequency and low frequency. The high frequency field is driven by data and statistical laws, and pays more attention to data analysis; The amount of data is small, the model may be simple, but the reliability of the core logic needs to be fully verified. That's all for today's sharing, thank you.
If you want to get the "White Paper", you can scan the QR code below, add the [Finelite] customer service WeChat account, and get the electronic version!
